
Bike Rental Insights Dashboard
Interactive dashboard tying weather to bike rental trends.
Completed
·
Description
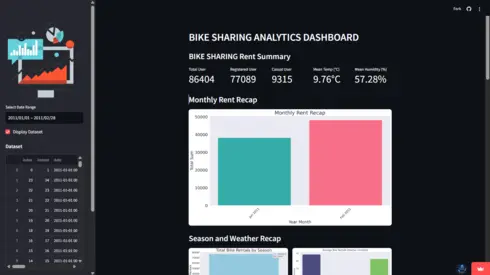
This dashboard dives into how weather drives bike rentals, breaking down trends by season, day, and conditions.
It uses data analysis to help bike companies optimize fleets and pricing based on forecasts.
Filter by temp, humidity, or time to uncover patterns, with ML models predicting future demand.
Features
Season Trends
Shows peak biking seasons.
Weather Impact
Links conditions to rental spikes.
Day Breakdown
Compares weekdays vs. weekends.
Streamlit UI
Interactive charts for easy insights.
Tech Stack

Python
Versatile programming language for web development, data science, and automation

Streamlit
Framework for building data science web applications

TensorFlow
Open-source machine learning framework